Understanding Inconsistent State Environmental Record Reporting in the EPA’s Facilities Registry Service

Motivation
Community Lattice created the Platform for Exploring Environmental Records (PEER) to offer the public a portal to access publicly available environmental records to inform brownfields redevelopment decisions. Upon initial release, data were compiled from three sources from the US Environmental Protection Agency (EPA): the Facilities Registry Service (FRS), the Underground Storage Tank (UST) Finder, and the Landfill Methane Outreach Program (LMOP) database.
Of particular interest is the FRS database, as it pulls together and synthesizes datasets from over 100 state and federal programs, and it supplies the vast majority (71%) of all data presented in PEER. While the FRS contains comprehensive coverage of sites subject to federal reporting requirements – including the National Priorities List (NPL, aka Superfund), the Toxic Release Inventory (TRI), and the Resource Conservation and Recovery Act (RCRA) – facilities that are subjected to state reporting requirements – including Voluntary Cleanup Programs (VCP) and Leaking Petroleum Storage Tanks (LUST) – are not required to report the FRS, resulting in widely varying coverage between states.
Here we analyze the number of facilities across the country in order to give PEER users a better understanding of the veracity of reporting in their state.
Federally Reported Facilities
Figure 1. Total facilities reported the FRS for federal environmental programs. (a) Map showing total number of facilities by state. (b) Histogram showing the distribution of number of facilities by state. (c) Map showing number of facilities per 1000 people by state. (d) Histogram showing the distribution of number of facilities per 1000 people by state. Note that colors on maps and binning for histograms are on a logarithmic scale.
The number of federal reported facilities varies widely by state, ranging from 3,183 (DE) to 151,475 (CA). Unsurprisingly, the total number of facilities by state tracks closely with state population. To further examine this, we also analyzed the number of facilities per 1000 people by state, resulting in a range of 2.2 (AZ) to 18.6 (WV) facilities per 1000 people. It is important to note that the histogram of facilities per 1000 people (Figure 1d) – which shows how many states fall into a certain range – displays a normal distribution (aka “bell curve”), indicating that reporting is likely comprehensive for these federal programs.
State Reported Facilities
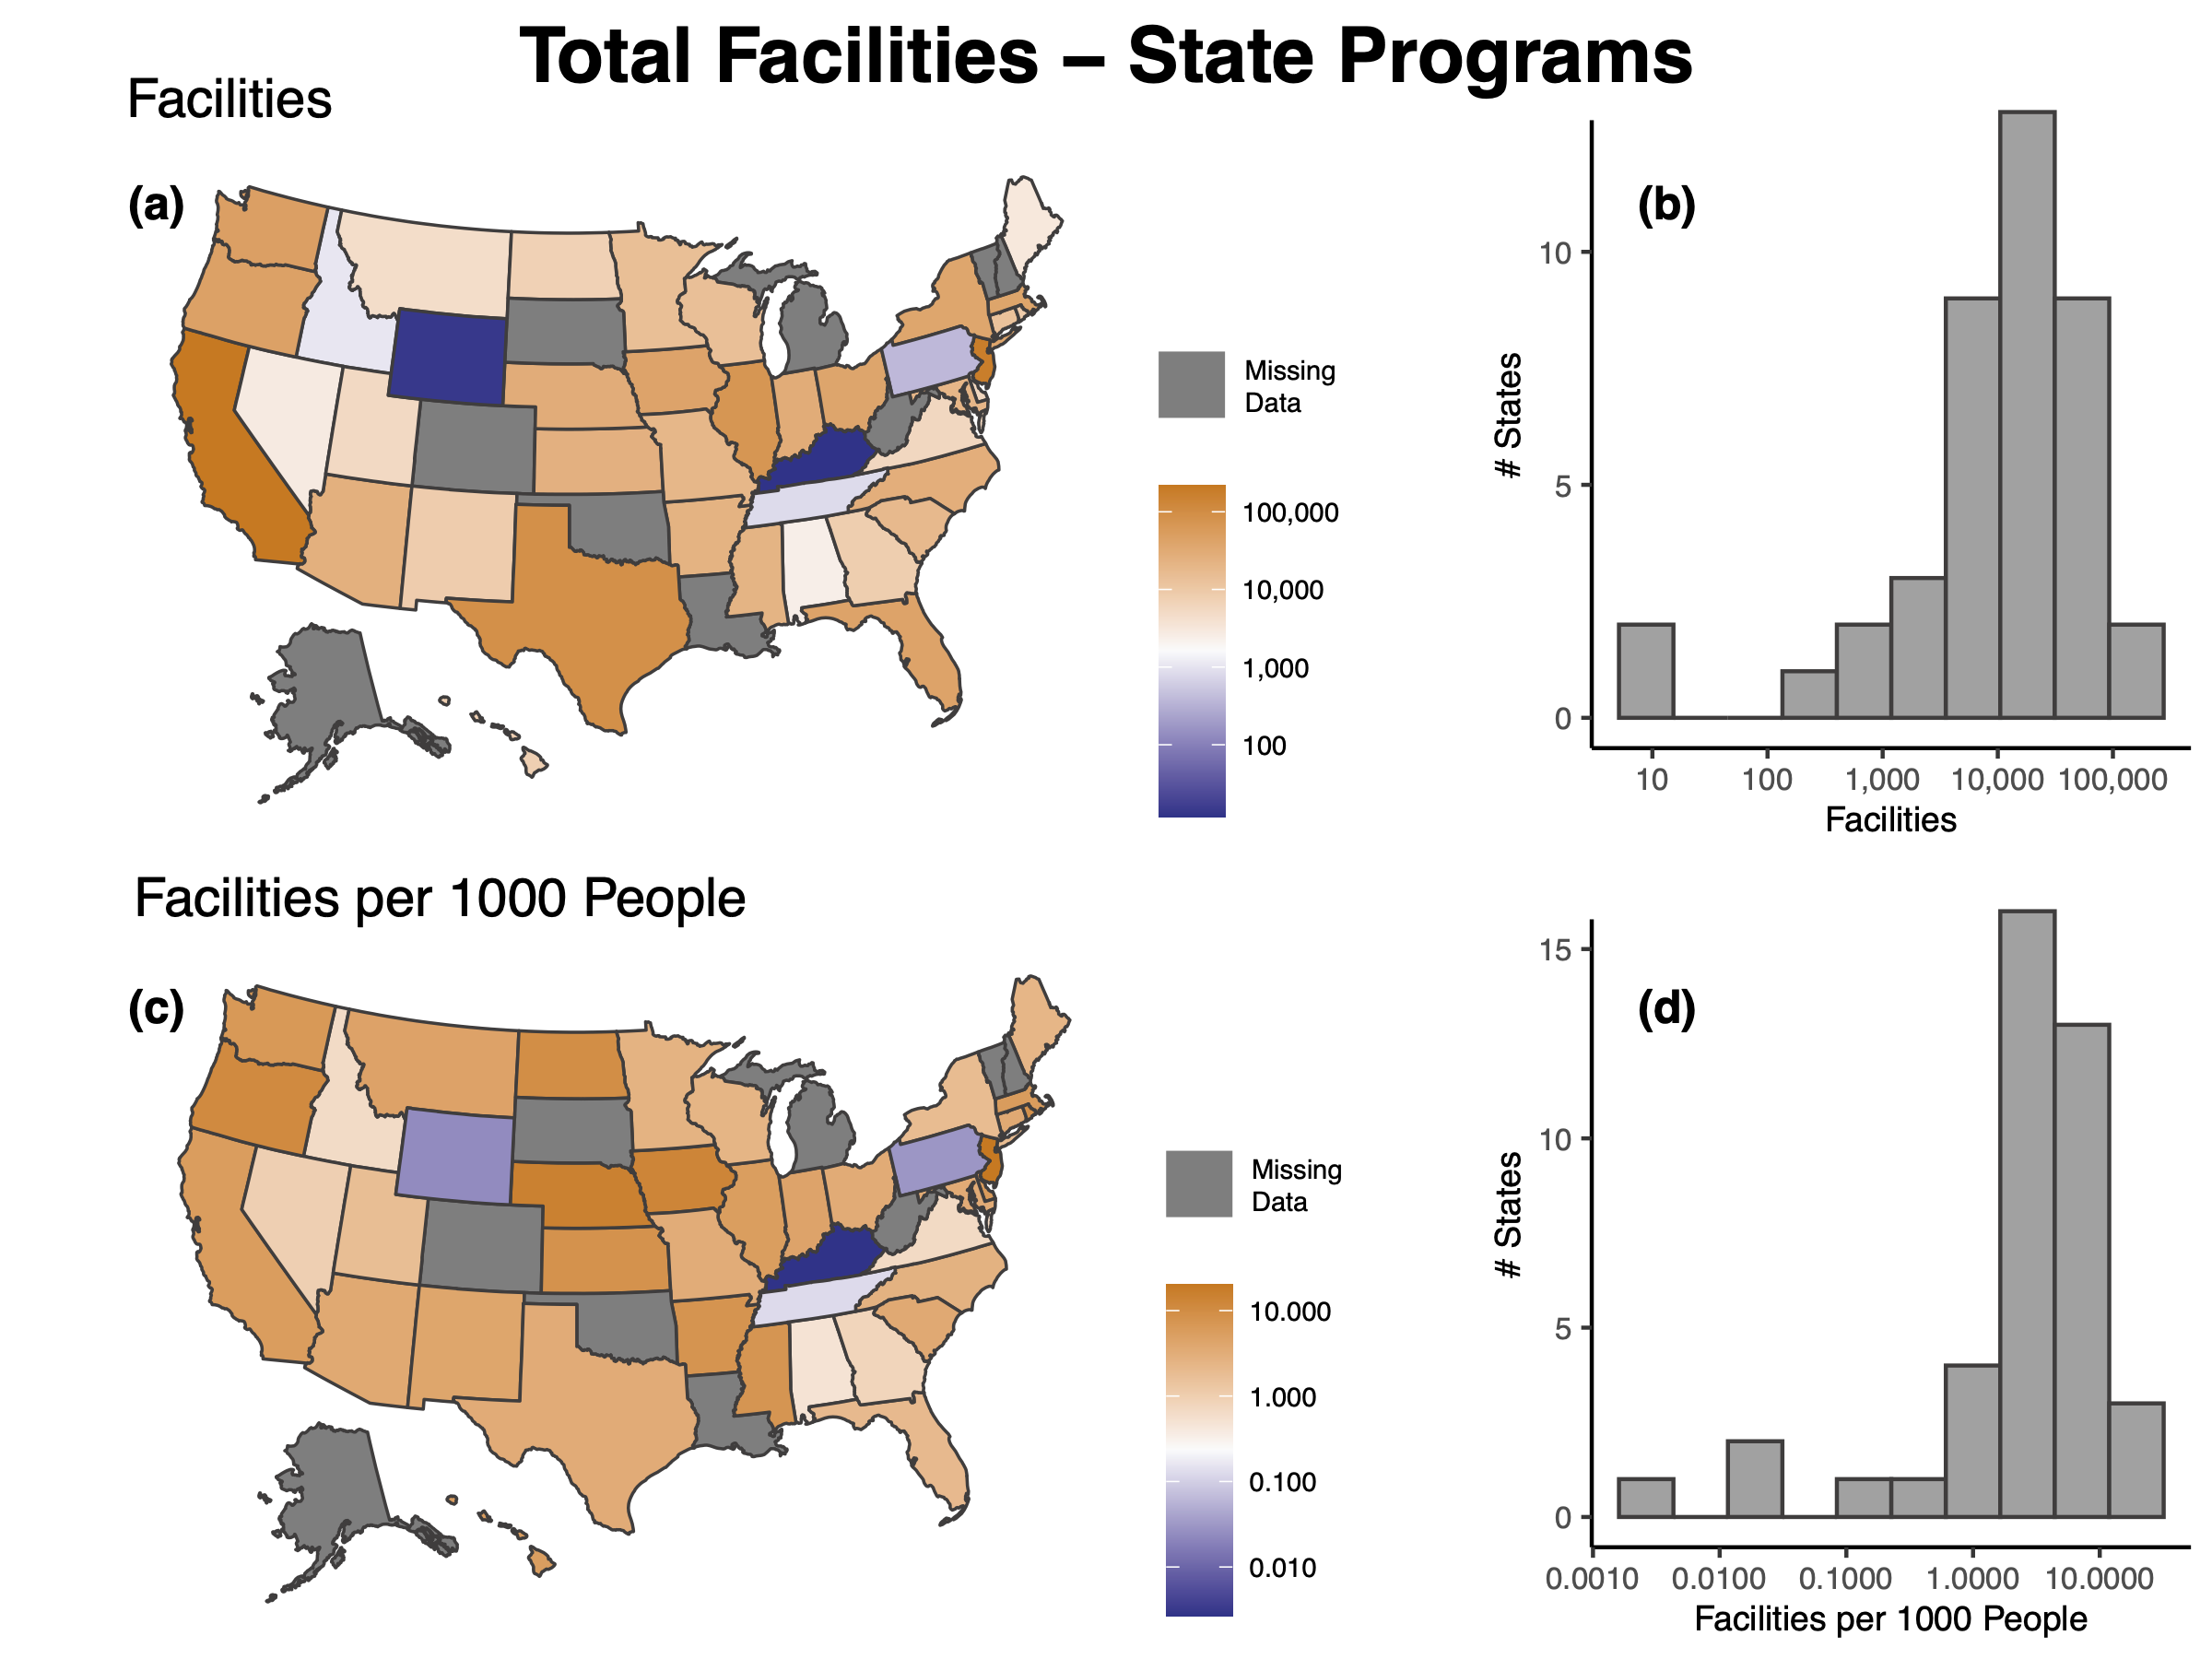
Figure 2. Total facilities reported the FRS for state environmental programs. (a) Map showing total number of facilities by state. (b) Histogram showing the distribution of number of facilities by state. (c) Map showing number of facilities per 1000 people by state. (d) Histogram showing the distribution of number of facilities per 1000 people by state. Note that colors on maps and binning for histograms are on a logarithmic scale.
The most important thing to note from this data is that 9 states – AK, CO, LA, MI, NH, OK, SD, VT, WV – and Washington DC do not report any state environmental records to the FRS. This means that FRS data for these states is limited to federal programs only.
For the states that do report facilities to the FRS, the number of state-reported facilities has a much wider range than for federal programs, ranging from 12 (KY) to 217,499 (CA). While the upper end of number of facilities per 1000 people is similar in state and federal reporting (20.1 for NJ), the lower end is much smaller (0.003 for KY). Importantly, the histogram of facilities per 1000 people (Figure 2d) does not show the same normal distribution that we see in federal facility reporting. Instead, we see outliers at the lower end of the spectrum (confirmed as falling 1.5x outside the interquartile range), indicating that these states – KY, PA, TN, WY – are likely not fully reporting all state environmental records to the FRS.
Implications for PEER
For any state, PEER should only be used as an initial screening tool and does not replace standard due diligence; moreover, if you are using PEER in a state with no/low reporting, you are more likely to miss some facilities with known environmental records in your initial screening efforts that have the potential to impact brownfields redevelopment efforts. In fact, when we look at the states that aren’t considered outliers, we find that the median value of facilities per 1000 people is ~3.7, which translates into ~200,000 missing facilities in states with low/no reporting.


